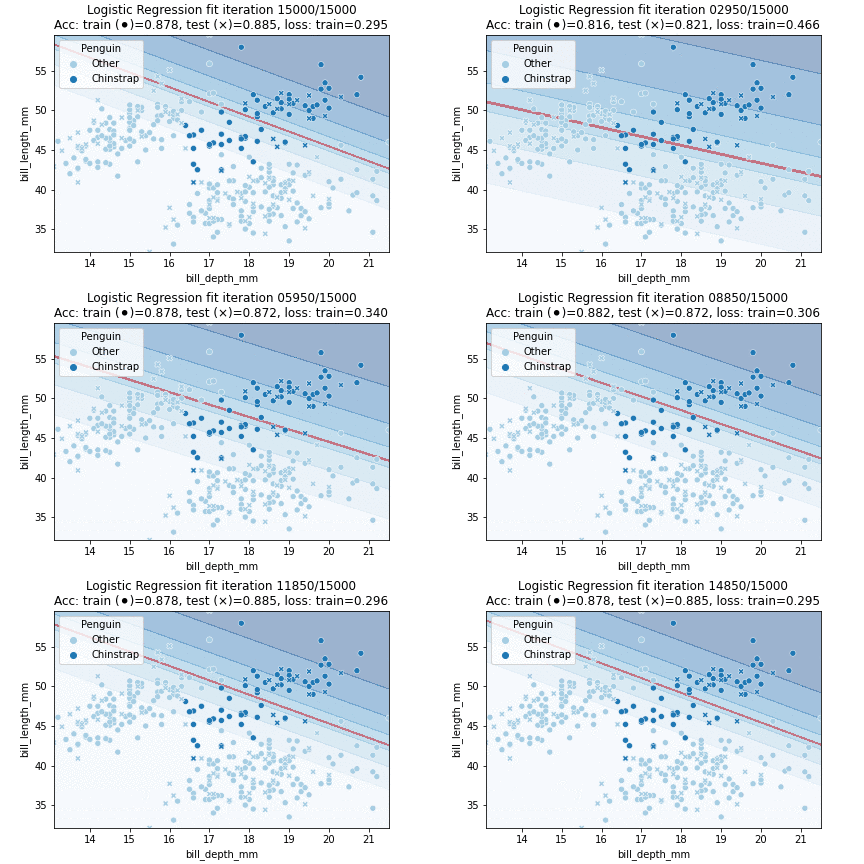
Notebook producing the figures in Linear Regression to Neural Networks. Chapter on Logistic Regression. We are going to fit a Logistic Regression model to try and classify some Penguin species data. We are going to produce this plot:
Let's go!
For all source files, see Github repository.
import seaborn as sns
import numpy as np
import pandas as pd
import matplotlib.pyplot as plt
from IPython.display import set_matplotlib_formats
from IPython.display import HTML
import IPython
from matplotlib.animation import FuncAnimation
from time import time
from tqdm.notebook import tqdm
from sklearn.linear_model import SGDClassifier
from sklearn.metrics import log_loss
import tempfile
import shutil
%matplotlib inline
set_matplotlib_formats('svg')
!python --version
Python 3.9.2
from sklearn.exceptions import ConvergenceWarning
import warnings
with warnings.catch_warnings():
warnings.filterwarnings("ignore", category=ConvergenceWarning)
data = sns.load_dataset('penguins')
data = data.dropna()
data.dtypes
species object island object bill_length_mm float64 bill_depth_mm float64 flipper_length_mm float64 body_mass_g float64 sex object dtype: object
sns.pairplot(data=data, hue='species')
<seaborn.axisgrid.PairGrid at 0x10e6bda30>
peng = lambda x: 'Chinstrap' if x == 'Chinstrap' else 'Other'
data['Penguin'] = data['species'].apply(peng)
rs = np.random.RandomState(34)
test = rs.choice(data.index, len(data) // 4)
train = data.index[~data.index.isin(test)]
data.loc[train, 'subset'] = 'Train'
data.loc[test, 'subset'] = 'Test'
data_train = data[data['subset'] == 'Train']
data_test = data[data['subset'] == 'Test']
data.groupby('subset').count()[['species']]
species | |
---|---|
subset | |
Test | 78 |
Train | 255 |
blue_colors = sns.color_palette("Paired", n_colors=2)
sns.scatterplot(data=data, x='bill_depth_mm', y='bill_length_mm',
hue='Penguin', palette=blue_colors, style='subset',
style_order=['Train', 'Test'])
<AxesSubplot:xlabel='bill_depth_mm', ylabel='bill_length_mm'>
clf = SGDClassifier(max_iter=50, tol=None, loss='log', alpha=0.0,
learning_rate='constant', eta0=0.001, random_state=33,
verbose=0, warm_start=True)
X = data_train[['bill_depth_mm', 'bill_length_mm']].values
y, labels = pd.factorize(data_train['Penguin'])
Y = np.expand_dims(y, axis=1)
X_test = data_test[['bill_depth_mm', 'bill_length_mm']].values
y_test, _ = pd.factorize(data_test['Penguin'])
Y_test = np.expand_dims(y_test, axis=1)
clf.fit(X, y)
classes = clf.classes_
clf.coef_, clf.intercept_, clf.n_iter_, clf.classes_
(array([[-0.11750903, 0.05547049]]), array([-0.24530203]), 50, array([0, 1]))
clf.fit(X, y)
clf.n_iter_, clf.coef_, clf.t_
(50, array([[-0.11041536, 0.05812061]]), 12751.0)
def combine_coefs(clf):
coef = np.append(clf.intercept_, clf.coef_)
coef = np.expand_dims(coef, axis=0).T
return coef
combine_coefs(clf)
array([[-0.48528539], [-0.11041536], [ 0.05812061]])
decision_function = lambda X, coef: X @ coef
predict_proba_lr = lambda X, coef: 1. / (1. + np.exp(-decision_function(X, coef)))
predict_proba_lr([[1, 2, 3]], combine_coefs(clf))
array([[0.37010783]])
def add_bias(X):
n, p = X.shape
bias = np.ones((n, 1))
X = np.hstack([bias, X])
return X
X.shape, add_bias(X).shape
((255, 2), (255, 3))
def get_losses(coef):
pred = predict_proba_lr(add_bias(X), coef)
loss = log_loss(y, pred)
pred_test = predict_proba_lr(add_bias(X_test), coef)
loss_test = log_loss(y_test, pred_test)
return [loss, loss_test]
get_losses(combine_coefs(clf))
[0.7374884266002778, 0.7569569316061243]
def get_acc(pred, Y):
class_pred = np.array(pred > 0.5).astype(int)
acc = (class_pred == Y).sum() / len(Y)
return acc
def get_accs(coef):
pred = predict_proba_lr(add_bias(X), coef)
pred_test = predict_proba_lr(add_bias(X_test), coef)
return get_acc(pred, Y), get_acc(pred_test, Y_test)
get_accs(combine_coefs(clf))
(0.6196078431372549, 0.6538461538461539)
max_iter = 50
iterations = 30000
n_fits = iterations // max_iter
clf = SGDClassifier(max_iter=max_iter, tol=None, loss='log', alpha=0.0005,
learning_rate='constant', eta0=0.001, random_state=33,
verbose=0, warm_start=True)
history = np.array([])
pbar = tqdm(range(n_fits))
curr_iter = 0
for i in pbar:
clf.fit(X, y)
coef = combine_coefs(clf)
loss = get_losses(coef)
acc = get_accs(coef)
curr_iter = curr_iter + clf.n_iter_
history = np.append(history, {
'coef': combine_coefs(clf),
'loss': get_losses(coef),
'acc': get_accs(coef),
'iteration': curr_iter
})
pbar.set_description(f'loss={loss[0]:.3f}')
coefs = [hist['coef'] for hist in history]
losses = [hist['loss'] for hist in history]
accs = [hist['acc'] for hist in history]
iters = [hist['iteration'] for hist in history]
df1 = pd.DataFrame(accs, columns=['Train', 'Test'])
df1 = df1.melt(value_name='Acc')
df2 = pd.DataFrame(losses, columns=['Train', 'Test'])
df2['iteration'] = iters
df2 = df2.melt(id_vars='iteration', value_name='Loss', var_name='Subset')
df = df1.join(df2)
df
variable | Acc | iteration | Subset | Loss | |
---|---|---|---|---|---|
0 | Train | 0.619608 | 50 | Train | 0.742084 |
1 | Train | 0.619608 | 100 | Train | 0.737484 |
2 | Train | 0.623529 | 150 | Train | 0.732833 |
3 | Train | 0.623529 | 200 | Train | 0.728130 |
4 | Train | 0.623529 | 250 | Train | 0.723376 |
... | ... | ... | ... | ... | ... |
1195 | Test | 0.897436 | 29800 | Test | 0.294351 |
1196 | Test | 0.897436 | 29850 | Test | 0.294370 |
1197 | Test | 0.897436 | 29900 | Test | 0.294389 |
1198 | Test | 0.897436 | 29950 | Test | 0.294408 |
1199 | Test | 0.897436 | 30000 | Test | 0.294428 |
1200 rows × 5 columns
fig, (ax1, ax2) = plt.subplots(1, 2, figsize=(10, 3.5))
sns.lineplot(data=df, x='iteration', y='Acc', hue='Subset', ax=ax1)
sns.lineplot(data=df, x='iteration', y='Loss', ax=ax2)
plt.suptitle('Logistic Regression penguin classification accuracy/loss')
plt.savefig('images/logistic-metrics.svg')
def apply_over_grid(X, clf, *args):
xaxis = np.linspace(X[:, 0].min(), X[:, 0].max(), 100)
yaxis = np.linspace(X[:, 1].min(), X[:, 1].max(), 100)
xx, yy = np.meshgrid(xaxis, yaxis)
zz = np.dstack([xx, yy])
ax1, ax2, ax3 = zz.shape
X = zz.reshape((ax1 * ax2, ax3))
zz = clf(X, *args)
zz = zz.reshape((ax1, ax2))
return xx, yy, zz
xx, yy, zz = apply_over_grid(X, lambda X: X.sum(axis=1))
X.shape, xx.shape, yy.shape, zz.shape
((255, 2), (100, 100), (100, 100), (100, 100))
def decision_region(coef, ax):
predictor = lambda X, coef: predict_proba_lr(add_bias(X), coef)
vals = data[['bill_depth_mm', 'bill_length_mm']].values
xx, yy, zz = apply_over_grid(vals, predictor, coef)
plt.contourf(xx, yy, zz, alpha=0.7,
levels=[0.495, 0.505], colors=['red'])
plt.contourf(xx, yy, zz, alpha=0.4, cmap='Blues')
sns.scatterplot(data=data_train,
x='bill_depth_mm', y='bill_length_mm',
hue='Penguin', palette=blue_colors, ax=ax)
sns.scatterplot(data=data_test,
x='bill_depth_mm', y='bill_length_mm',
hue='Penguin', palette=blue_colors, ax=ax,
legend=False,
style='subset', style_order=['Train', 'Test'])
fig = plt.figure()
ax = fig.gca()
decision_region(coefs[-1], ax)
plt.colorbar()
f"loss={losses[-1]}, acc={accs[-1]}"
'loss=[0.3044399298663325, 0.29442757356266686], acc=(0.8823529411764706, 0.8974358974358975)'
folder = tempfile.mkdtemp()
print(f'Saving images to {folder}')
Saving images to /var/folders/34/923qqr696yz_ybx0dl171fn80000gn/T/tmpld_47z24
import time
frames = 150
iter_right_lim = 15000
n_fits_show = iter_right_lim // max_iter
intervals = n_fits_show // frames
pbar = tqdm(total=frames)
iters = np.array(iters)
idxes = np.argwhere(iters <= iter_right_lim)
idxes = np.squeeze(idxes)
indexes = idxes[:-2]
indexes = indexes[np.arange(0, len(indexes), step=intervals)]
idxes = np.append(idxes[-1], indexes)
def create_frame(frame, ax, coefs):
ax.cla()
i = idxes[frame]
coef = coefs[i]
loss = losses[i][0]
loss_test = losses[i][1]
acc = accs[i][0]
acc_test = accs[i][1]
iteration = iters[i]
decision_region(coef, ax)
plt.title(f'Logistic Regression fit iteration {iteration:05}/{iter_right_lim}\n'+
f'Acc: train (⚫︎)={acc:.3f}, test (×)={acc_test:.3f}, '+
f'loss: train={loss:.3f}')
pbar.update()
plt.savefig(f'{folder}/frame_{frame:03}.png')
fig = plt.figure()
ax = fig.gca()
animation = FuncAnimation(fig, create_frame, frames=frames,
fargs=(ax, coefs), interval=100)
# Interval at 1000/100 = 10 frames per second
animated = animation.to_jshtml()
pbar.close()
!convert -background white -alpha remove -dispose Previous +antialias -layers OptimizePlus $folder/*.png ./images/logistic-fit.gif
shutil.rmtree(folder)
Code written by Jeroen Overschie. MIT licensed.