Analyze algorithm stability
For many applications, it is very important the algorithms that are used are stable enough. This means, that when a different sample of data is taken from some distribution, the results will turn out similar. This, combined with possible inherent stochastic properties of an algorithm, make up for the stability of the algorithm. The same applies to Feature Selection or Feature Ranking algorithms.
Therefore, let's do such an experiment! We are going to compare the stability of ReliefF to Boruta, two popular feature selection algorithms. We are going to do this using a metric introduced in Nogueira et al, 2018.
The experiment
We are going to run an experiment with the following configuration. Download the experiment config: algorithm-stability-yaml.zip.
Most notably are the following configuration settings:
defaults:
  - base_pipeline_config
  - _self_
  - override dataset: synclf_hard
  - override validator: knn
  - override /callbacks:
      - to_sql
  - override /metrics:
      - stability_nogueira

n_bootstraps: 10
That means, we are going to generate a synthetic dataset and sample 10 subsets from it. This is because n_bootstraps=10. Then, after the feature selection algorithm was executed and fitted on the dataset, a custom installed metric will be executed, called stability_nogueira. This can be found in the /conf/metrics folder, which in turn refers to a class in the benchmark.py file.
To now run the experiment, run the following command inside the algorithm-stability-yaml folder:
python benchmark.py --multirun ranker="glob(*)" +callbacks.to_sql.url="sqlite:///$HOME/results.sqlite"
Analyzing the results
Recap
Hi! Let's analyze the results of the experiment you just ran. To recap:
You just ran something similar to:
python benchmark.py --multirun ranker="glob(*)" +callbacks.to_sql.url="sqlite:///$HOME/results.sqlite"There now should exist a
.sqlitefile at this path:$HOME/results.sqlite:$ ls -al $HOME/results.sqlite
-rw-r--r-- 1 vscode vscode 20480 Sep 21 08:16 /home/vscode/results.sqlite
Let's now analyze the results! 📈
Analysis
The rest of the text assumes all code was ran inside a Jupyter Notebook, in chronological order. The source Notebook can be found here
First, we will install plotly-express, so we can make nice plots later.
%pip install plotly-express --quiet
Figure out the SQL connection URI.
import os

con: str = "sqlite:///" + os.environ["HOME"] + "/results.sqlite"
con
'sqlite:////home/vscode/results.sqlite'
Read in the experiments table. This table contains metadata for all 'experiments' that have been run.
import pandas as pd

experiments: pd.DataFrame = pd.read_sql_table("experiments", con=con, index_col="id")
experiments
| dataset | dataset/n | dataset/p | dataset/task | dataset/group | dataset/domain | ranker | validator | local_dir | date_created | |
|---|---|---|---|---|---|---|---|---|---|---|
| id | ||||||||||
| 38vqcwus | Synclf hard | 10000 | 50 | classification | Synclf | synthetic | Boruta | k-NN | /workspaces/fseval/examples/algorithm-stabilit... | 2022-09-21 08:22:28.965510 |
| y6bb1hcc | Synclf hard | 1000 | 50 | classification | Synclf | synthetic | Boruta | k-NN | /workspaces/fseval/examples/algorithm-stabilit... | 2022-09-21 08:22:53.609396 |
| 3vtr13pg | Synclf hard | 1000 | 50 | classification | Synclf | synthetic | ReliefF | k-NN | /workspaces/fseval/examples/algorithm-stabilit... | 2022-09-21 08:25:09.974370 |
That's looking good 🙌🏻.
Now, let's read in the stability table. We put data in this table by using our custom-made metric, defined in the StabilityNogueira class in benchmark.py. There, we push data to this table using callbacks.on_table.
stability: pd.DataFrame = pd.read_sql_table("stability", con=con, index_col="id")
stability
| index | stability | |
|---|---|---|
| id | ||
| y6bb1hcc | 0 | 0.933546 |
| 3vtr13pg | 0 | 1.000000 |
Cool. Now let's join the experiments with their actual metrics.
stability_experiments = stability.join(experiments)
stability_experiments
| index | stability | dataset | dataset/n | dataset/p | dataset/task | dataset/group | dataset/domain | ranker | validator | local_dir | date_created | |
|---|---|---|---|---|---|---|---|---|---|---|---|---|
| id | ||||||||||||
| y6bb1hcc | 0 | 0.933546 | Synclf hard | 1000 | 50 | classification | Synclf | synthetic | Boruta | k-NN | /workspaces/fseval/examples/algorithm-stabilit... | 2022-09-21 08:22:53.609396 |
| 3vtr13pg | 0 | 1.000000 | Synclf hard | 1000 | 50 | classification | Synclf | synthetic | ReliefF | k-NN | /workspaces/fseval/examples/algorithm-stabilit... | 2022-09-21 08:25:09.974370 |
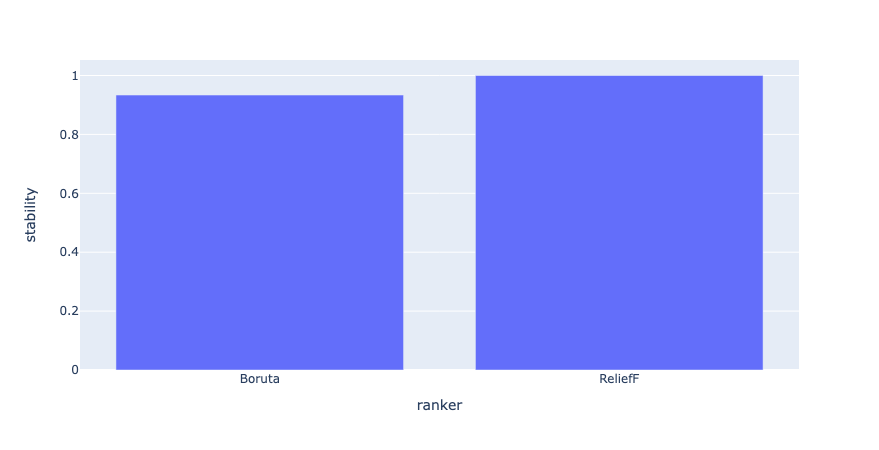
Finally, we can plot the results so we can get a better grasp of what's going on:
import plotly.express as px

px.bar(stability_experiments,
    x="ranker",
    y="stability"
)

We can now observe that for Boruta and ReliefF, ReliefF is the most 'stable' given this dataset, getting 100% the same features for all 10 bootstraps that were run.